Introduction
Measuring customer experience is embedded in most healthcare companies to support strategic and tactical changes and improve overall financial goals.1 A key element of understanding your customer experience is to understand how you are performing versus the competition. By understanding how your brand is competing with competition, you will learn how to differentiate and how to drive your customer experience.
This research will discuss how to research competitive customer experience and how to use the difference customer experience value drivers to make the relative positioning of your brand.
Methodology
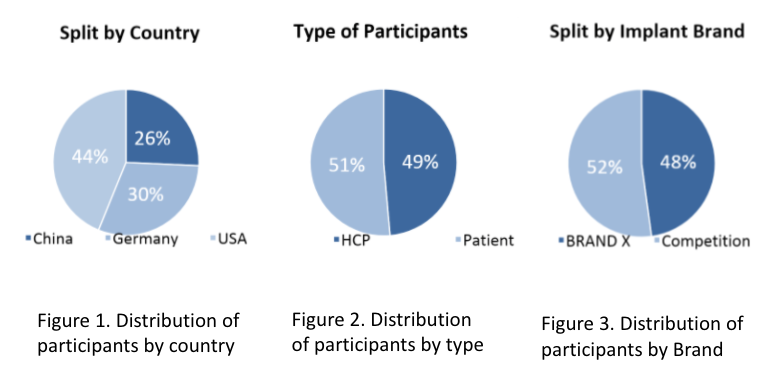
A cross sectional study was performed of to measure customer experience of HCPs and Patients in implanting and receiving an implantable hearing aid (Cochlear Implant). The study was performed in the US, Germany and China in 2012 and repeated in 2017. HCP and patients were recruited via telephone and/or patient organizations. Interviews were done by structured phone interviews.
For measurement of customer experience the Net Promoter Score2 (NPS) methodology (scale 0-10) was used. Primary question was; “Based on your experience with [BRAND], how likely are you to recommend [BRAND] to a colleague or a person considering a hearing implant?”. To understand the qualitative experience drivers, additional qualitative questions were added; “Why do you give this score?”, “What is the primary reason you would recommend [BRAND], and “What is the primary area [BRAND] should improve upon to make you more likely to recommend [BRAND]?”. The NPS score was calculated based on the rating and segmenting respondents in Detractors (score 0-6), Passives (score 7-8) and Promotors (score 9-10). NPS score is the % of Promotors minus % of Detractors. Results of the open-ended questions were coded as verbatims and bucketed.
Results
Overall NPS score
Overall NPS was not significantly changing for 2012 (33%) to 2017 (32%). However if we compare the different brands, we see that BRANDX grew from 40% in 2012 to 49% in 2017. Competition decreased from 25% in 2012 to 18% in 2017. (figure 4)
Value Drivers
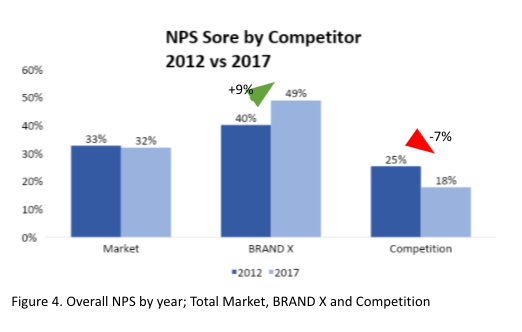
Overall, a grouped analysis of the counted verbatims indicate five main important customer experience drivers; 59% Product related items, 18% Participant related items (e.g. Quality of Life, Familiarity, Ease of Surgery), 12% Service, 9% Company and 2% Costs related. (figure 5)
Net Verbatim Score
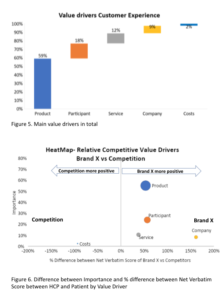
The value drivers reveal what elements are driving respondents to give a certain score. However, these value drivers are both positive and negative verbatims. By deducting the negative from positive verbatims, we can construct the Net Verbatim Score (NVS). We can visually represent the importance of the value driver versus the % difference between NVS of BRANDX versus Competition. BRANDX is outperforming Competition on the most important value drivers Product and Participant items. Additionally, BRANDX is also outperforming competition on lesser important Service and Company. Competitions is outperforming BRANDX on Costs. (figure 6)
Conclusion
Understanding customer experience by measuring competitive NPS can reveal the absolute and relative NPS growth. Additionally, competitive NPS methodology allow medical device manufacturers to understand the customer experience value drivers and their relative position towards competition.
By conducting competitive NPS research medical device manufacturers could improve and adapt their strategies and tactics to be in line with value drivers and be ahead of competition.
References
- Keiningham, Timothy L., Bruce Cooil, Tor Wallin Andreassen and Lerzan Aksoy (2007), “A Longitudinal Examination of Net Promoter and Firm Revenue Growth,” Journal of Marketing, 71 (3), 39-51.)
- Reichheld, Frederick F. (December 2003) . One Number You Need to Grow. Harvard Business Review .
SUAZIO is an expert in medical devices and diagnostics strategic insights creation.
If you are interested to learn more about this data, please contact Jasper van de Sande, j.vandesande@suazio.com.